?
首先我们打开Anaconda, 在里面点击Spyder。
First we open Anaconda, click Spyder inside.
?
这里我已经为大家准备好三份数据,分别是比特币日K线 ,比特币4小时K线 ,以及sh000688科创50指数日K线 :
Here I have prepared three data for you: the Bitcoin Kline the four-hour Bitcoin Line K Line #xff1a;
?
K线数据文件
?
标题sh000688数据展示
?
?
除此之外,还有我们的4个程序文件:
In addition to #xff0c; and our four procedural documents #xff1a;
?
?
如果你需要这些代码和数据,可以加我微信xingbuxing0809 ,可以发给你。
If you need these codes and data xff0c; you can send me micro-mailsxing0809 , you can send them to me.
?
以比特币4小时K线 为例,打开“1_画K线.py ”这个程序:
Take the four-hour line K of Bitcoin as an example of #xff0c; click on to open the application “1_Draw Kline.py ;
?
1_画K线.py
?
其中第1、2的代码意思是导入我们事先安装好的第三方库,第5到第7行是导入本次作图需要用到的数据。
The code for 1 and 2 is to import the third-party library that we have installed in advance xff0c; line 5 to line 7 is to import the data required for this drawing.
?
选中前7行代码,点击鼠标右键,再点击“Run Cell ”,运行这几行代码:
Select the first seven lines & #xff0c; click on the right mouse button & #xff0c; click on Run Cell, run these lines & #xff1a;
选中代码后,单击鼠标右键
?
在界面右侧的Variable 中可以看到,数据已经导入到程序中了:
xff0c can be seen at Variable on the right side of the interface; the data has been imported into the program xff1a;
?
我们在此双击“df”变量,便可以看到已经被导入的K线数据:
We double-click the "df" variable & #xff0c; you can see the imported K-line data & #xff1a;
?
接下来我们用导入的这份数据画K线图:
Next, we use this imported data to draw K-lines & #xff1a;
?
作图部分代码
?
作图部分的代码是设置K线的颜色 和风格 。
The graphic code is the colours and styles that set the K-lines
?
如果我们希望K线的颜色和国内A股市场一样红涨绿跌 ,那么只需要把参数设置为:
If we want the Kline color to be the same as the domestic A share market #xff0c > ; then just set the parameters to xff1a;
?
up=’red ’? down=’green ’
?
第13行代码中edge 的意思是设置K线边框的颜色 ,默认是黑色,edge=’inherit’ 的意思是保持K线边框的颜色与K线实体颜色一致。
In line 13, edge means that the colour of the K line border is set , by default it is black xff0c; edge= `inherit'
运行全部代码,就可以画出比特币最近一段时间的K线图:
Runs all the codes & #xff0c; you can draw K-line maps for the most recent period in Bitcoin & #xff1a;
?
?
想要修改图中的纵坐标名称,只需修改代码第18行代码里的ylabel 参数即可:
To change the vertical coordinate name in the diagram & #xff0c; simply to modify the parameters of ylabel in the code line 18 & #xff1a;
?
现在我们已经可以画K线图了,那应该如何在普通的K线图中加入成交量呢?
Now we can draw K-lines & #xff0c; how should we add a turnover to the regular K-lines & #xff1f;
?
02
加入成交量
Add transaction
?
打开“2_加入成交量.py ”这个新的程序:
Open the new program 2_Additional amount.py xff1a;
?
2_加入成交量.py
?
?
这个程序前10行的代码和“1_画K线.py” 程序完全一致,也是导入第三方库和读取数据。
The code in the first 10 lines of this program is fully consistent with the "1_Draw Kline.py"
?
不同之处在于:
The difference is #xff1a;
?
首先,在第14行新增了一个volume 参数,volume=’inherit’ 意思是将成交量柱状图的颜色 设置为红涨绿跌,与K线一致。
First xff0c; add a new parameter for volume xff0c; volume= 'inherit'
?
其次,第19行作图代码中新增两个参数,volume=True 的意思是将成交量添加到图中。ylabel_lower=’volume’ 意思是将成交量图的纵坐标命名为“volume”。
Second & #xff0c; Add two new parameters in the 19th line graphic code & #xff0c; volume= True means adding the transaction to the chart. ylabel_lower= `volume' means naming the vertical coordinates of the volume map as `volume'.
?
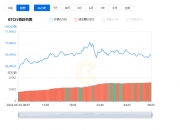
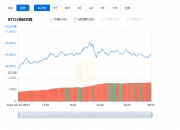
运行程序之后,可以看到添加了成交量的K线图:
After running the program xff0c; K-line diagrams xff1a added to the volume can be seen;
?
下方的柱状图表示成交量(红涨绿跌)
?
想要修改成交量纵坐标的名称,只需修改代码第20行代码里的ylabel_lower 参数即可:
To change the name xff0c of the transactional vertical coordinates; simply to modify the parameters of ylabel_lower in the code line 20, xff1a;
?
?
接下来讲解一下如何在K线图中加入技术指标。
Here's how to add technical indicators to the K-line map.
?
03
加入技术指标
Add technical indicators
?
我们以均线为例,演示在K线图中添加技术指标。
We use the average line as an example xff0c; we demonstrate the addition of technical indicators in the K-line chart.
我给大家提供的数据里已经算好了均线,只需按照代码将均线指标添加到画图函数即可。
The data I have provided you have calculated the mean line & #xff0c; just add the mean line indicator to the drawing function by code.
均线数据字段
?
打开“3_加入均线.py ”程序:
Open 3_Inline.py & #xff1a;
3_加入均线.py
?
该程序的前16行代码和上面两个程序是相同的。
The first 16 lines of the procedure are identical to the two above.
不同之处在于:
The difference is #xff1a;
第19行新增一个变量add_plot , 赋值为10日均线’ma_10’ 和50日均线’ma_50’ ,并且将add_plot变量添加到第21行的mpf.plot()方法中。
Add a variable add_lot in line 19 to assign 10-day mean /ma_10'/strang' and 50-day mean /ma_50'
, and add the add_plot variable to the mpf.plot() method in line 21.
写好之后,运行程序,就能得到K线图:
After writing xff0c; running program xff0c; getting K-lined xff1a;
?
?
?
可以看到,K线中新增了两条移动平均线。蓝色 的是50日均线 ,橙色 的是10日均线 。
Two moving mean lines were added to xff0c; Kline. Blue is the 50-day mean and xff0c; Orange is the 10-day mean.
?
大家应该能感受到,过程其实很简单,我们只要像搭积木一样在画图函数里添加相应的参数即可。
You should be able to feel xff0c; the process is really simple xff0c; we just need to add the corresponding parameters to the drawing function like a building block.
?
最后再来看看,如何将交易策略的开仓平仓信号,添加到K线中。
And finally, look at #xff0c; how to get the open silo signal of the transaction strategy #xff0c; and add it to line K.
?
04
添加交易信号
Adds transactional signal
?
我给大家提供的数据已经包含了交易信号,只需按照代码将交易信号添加到画图函数即可。
The data I provide you already contain the transaction signal xff0c; just add the transaction signal to the drawing function by code.
?
数据中的交易信号
?
打开“4_加入买卖点.py ”程序:
Open 4_Participates.py & #xff1a;
?
4_加入买卖点.py
?
这个程序的前16行代码和“3_加入均线.py ”的程序是完全一样的。
The first 16 lines of this program have exactly the same code as the "3_inline.py
?
不同之处在于:
The difference is #xff1a;
?
?
第19-22行代码中,add_plot 变量新增了我们的交易信号。交易信号 分为三种:
In line 19-22, the xff0c; add_platt variable adds our transaction signal. transaction signal is divided into three categories of xff1a;
?
1.?signal_long :?做多的开仓信号
1. signal_long :? Do a lot of opening signals.
2.?signal_shor t:?做空的开仓信号
signal_shor t:? Empty opening signal?
3.?signal_0 :?平仓的信号
signal_0 :? Signals to level.
?
marker 参数用来设定交易信号图标的形状,marker=’^’ 表示向上的箭头,?marker=’v’ 表示向下的箭头,?marker=’o’ 表示圆圈。
The parameters of marker are used to set the shape of the transaction signal icon xff0c; marker= `marker= marker= .
?
color 参数可以用来控制颜色,color=’g’ 表示绿色(green), ‘y’表示黄色(yellow), ‘b’表示蓝色(blue),可以根据自己的偏好设定不同的颜色。
color parameters can be used to control colours xff0c;strong>collor= 'g'/strong' for green xff08; green & #xff09; `y' for yellow xff08; yellow) xff0c; b' for blue xff08; bluexff09; xff0c; different colours can be set according to their preferences.
?
运行程序,做出最终的行情分析器 :
Run the program & #xff0c; make the final strong & #xff1a;
?
?
图中红色向上的箭头表示开多仓 的位置,绿色向下的箭头表示开空仓 的位置,黄色圆圈表示平仓 的位置。
The red arrows in the figure indicate the location of
?
05
总结
summary
?
现在我们已经成功绘制出比特币4小时K线 ,加入了成交量 ,均线 ,并且还把我们自己的交易信号 添加到K线中。
Now we have successfully drawn the four-hour K-line and #xff0c; added the transaction volume & #xff0c; average to the K-line.
?
大家可以发现,编程其实也不难。就像搭积木一样,一点一点往上加就行。并且第四步的程序一共只需20几行Python代码 ,其中大部分还是注释和空格。
You can find xff0c; programming is not really difficult. Just like building blocks xff0c; just add up a little bit. And the fourth step would take 20 lines of Python code
& #xff0c; most of them are comments and spaces.
?
强烈建议感兴趣的同学可以自己尝试运行一下代码,体会会更不一样。加我微信xingbuxing0809 ,我可以把作图需要的数据和代码都发给你。
It's highly recommended that interested students try to run the code #xff0c; it's more different. And I can send you the data and the code that I need to make the drawings.
?
?
美化布局示例
币安(Binance)最新版本
币安交易所app【遇到注册下载问题请加文章最下面的客服微信】永久享受返佣20%手续费!
APP下载
官网地址
火币HTX最新版本
火币老牌交易所【遇到注册下载问题请加文章最下面的客服微信】永久享受返佣20%手续费!
APP下载
官网地址


发表评论